For each of the following, determine whether the response variable is numerical or categorical. If the response variable is categorical, is it binary? If it is not binary, list possible categories for the response variable.
The first one is confusing because it isn’t a response variable. I am going to ignore the “response” part.
In a survey, college students were asked how many hours per week they spend on the internet.
Numerical or categorical
I’d treat Hours as categorical, They will be estimating not measuring, nominally they spend x hours.
Binary?
No
List possible categories
0-4, 4-8, 8-12, … or 1, 2, 3, 4,…
In a survey, college students were asked, “What percentage of the time that you spend on the internet is not for course work?”
Numerical or categorical
Again, they aren’t measuring the time, they are estimating. I’d treat it as Categorical.
Binary?
No
List possible categories
0-10%, 10-20% etc.
In a survey, college students were asked, “What is your primary mode of transportation when traveling between campus and home?”
Numerical or categorical
Categorical
Binary?
No
List possible categories
personal vehicle, foot, bike, metro, cab, other.
In a survey, college students were asked whether or not they live on campus.
Numerical or categorical
Catergorical
Binary?
Yes
List possible categories
Yes or No
In a survey, college students were asked how many of their meals they prepare at home per week.
Numerical or categorical
Either, they could actually count this. How to treat it in a model depends on what you are trying to get.
Binary?
No
List possible categories
1, 2, 3,… or 1-5, 6-10, …
In a survey, college students were asked, “Which of the five main food groups constitutes the majority of your diet?”
Numerical or categorical
Categorical
Binary?
No
List possible categories
Grain, Fruit, Veg, Dairy, …
In a survey, smart phone users were asked whether or not they have used a web-based taxi service like Uber or Lyft.
Numerical or categorical
Categorical
Binary?
Yes
List possible categories
Yes or No
In a survey, smart phone users were asked how many times they used a web-based taxi service in the past three months.
Numerical or categorical
Either, that data could be pulled from the phone. If you wanted to use it quantitatively you could. If it’s an estimate, it’s better as a categorical.
Binary?
No
List possible categories
0, 1-10, …
2. Multiple-choice exam
On a multiple-choice exam, each of the 20 questions has 2 possible answers and only one correct response. Suppose, for each question, one student selects his responses completely at random.
Re-write: On a multiple choice test there are 2 options and 1 correct answer. Bob selects his responses at random(a) For Bob, X’s 1 through 20 represent if he answered correctly.Y is the total number answered correctlyWhat is the distribution of \(X_i\)?What is the distribution of \(Y\)?
Let \(X_i,\ i = 1,...,20\) represent whether the student answered the \(i\)th question correctly, and let \(Y\) represent the total number of answers the student gets correct. What is the distribution of \(X_i\)? What is the distribution of \(Y\)?
The question boils down to what are the proper distributions for binary data and count data. Bernoulli distributions are for binary data, Binomial for the sum of binary variables.
\(Pr(X = y) = \begin{pmatrix} n \\ 20 \end{pmatrix}0.5^{20}(1-0.5)^{n-20}\)
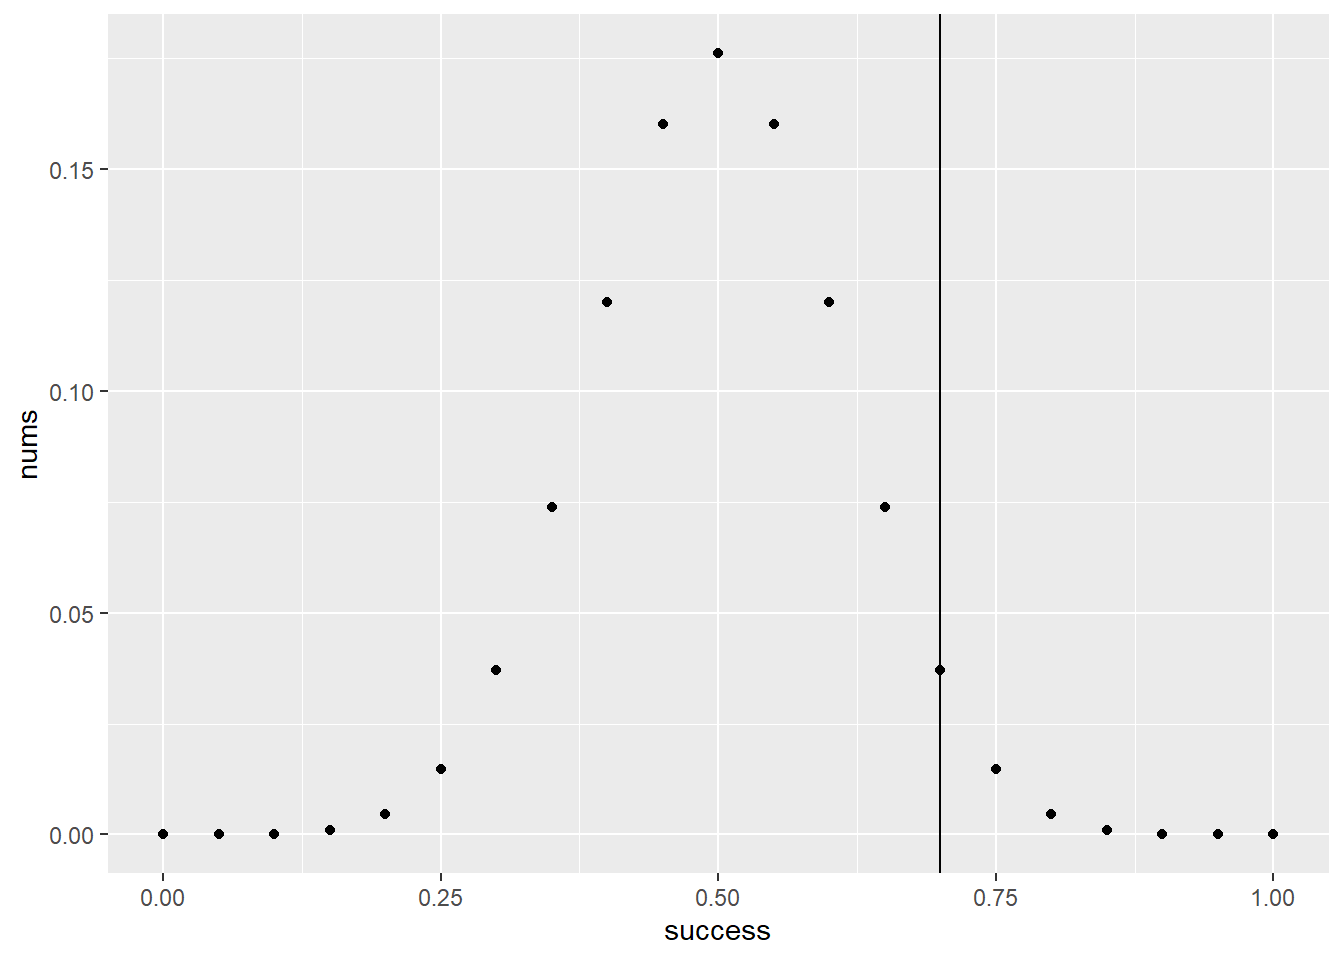
What is the probability that the student passes the test (i.e., scores at least 70%)? (You will learn more about this distribution in the next module, but you should be able to calculate this in R using the pbinom function.)
print(paste("The probability of getting a 70 percent by guessing with 50 50 odds is",pbinom(q = .7*(20), size =20, prob = .5, lower.tail = F) |>round(4)))
[1] "The probability of getting a 70 percent by guessing with 50 50 odds is 0.0207"
Correction
Answer to Part b) is incorrect. We want \(P(Y ≥ 14) = 1 - P(Y ≤ 13) = 1 - pbinom(x=13, n=20, p=0.5)=.058\)
Looking for the area on the right of the line That is
3. Online, on campus, or a hybrid
Do you prefer taking courses online, on campus, or a hybrid of the two? Suppose these preferences occur with probabilities (\(p_1, p_2, p_3\)). For \(N = 3\) independent subjects, let the observed frequencies be \((n_1, n_2, n_3)\). That is, we observe \(n_1\) subjects who prefer taking courses online, etc.
Explain how you can determine \(n_3\) from knowing \(n_1\) and \(n_2\).
If there are three people and each gets to pick one preference, then 3 minus the number who prefer online or hybrid is the number left who like campus.
List all the possible observations \((n_1, n_2, n_3)\), with \(n = 3\).
x <-expand.grid(0:3, 0:3, 0:3)x |>mutate(sums =rowSums(x[,1:3])) |>filter(sums ==3) |>select(1:3)
Var1
Var2
Var3
3
0
0
2
1
0
1
2
0
0
3
0
2
0
1
1
1
1
0
2
1
1
0
2
0
1
2
0
0
3
R Question
4. Consider ex2117
Consider the data in ex2117 of the Sleuth3 package.
In what format are these data (case, tabular, frequency, other)? Please explain.
ex2117 is the Effect of Stress During Conception on Odds of a Male Birth.
ex2117 |>head()
Group
Time
Number
PctBoys
Control
none
20337
51.2
Exposed
13-16mo
71
52.1
Exposed
12-7mo
789
49.6
Exposed
0-6mo
1922
48.9
Exposed
1st trimester
290
46.0
It’s pretty much a frequency table. I am not sure if a the two numerical columns change that. If one were to convert the numeric columns to the number of boys alone, that would be an ideal frequency table.
Create a new R data frame for the data, called HW1data. In that data frame, create a NumBoys column that represents the number of births that were boys (be sure to round to the nearest integer).